Employees leaving is expected, but costly. Here’s how to predict voluntary turnover and act before your top talent leaves.
If you ever lost an employee whose role was critical for the project or team, you know how hard it is to replace someone who seems irreplaceable. Turnover is expensive — the costs related to separation, replacement and training can be up to twice as much as the leaver’s salary.
The price can be particularly high when the decision to quit is made by the employee that the organization doesn’t want to see leaving.
Usually, those who receive competitive job offers are professionals in high-demand, with a singular combination of experience and qualifications, and when they resign, they leave big shoes to fill.
Once the employee is gone, there is little we can do. For this reason, we look at the factors that increase or decrease employee retention, and to how to measure and monitor turnover.
What causes voluntary employee turnover?
Various factors bring about voluntary turnover, but research pins down four factors of voluntary quitting — job characteristics, salary, managers, and stress.
Job characteristics
The role characteristics and the way the job is designed relate directly to employees’ intentions to leave.
Employees are more likely to stay in the jobs that provide them learning opportunities, variety of tasks, clear feedback on the progress that they are making, and autonomy to schedule their work and to determine the procedure to carry their tasks out.
Also, turnover tends to be lower in jobs that employees perceive as meaningful, and where they can see a “bigger picture” and understand how their work contributes to the final, larger outcome.
Salary
It’s no brainer that salary affects turnover.
It’s worth mentioning, however, that it’s not only about the monetary rewards.
Other benefits, such as training and opportunities for growth, make the employees more willing to stay.
Another relevant point that we should keep in mind, is that employees’ satisfaction with salary is a result of comparisons to professionals with a similar expertise in and outside the organization.
We can expect that the greater the gap to the employee’s disadvantage, the more likely they are to search for better opportunities and leave.
Managers
Supervisor’s behavior is related to employee job satisfaction and organizational commitment. In turn, the employees who are fulfilled and committed to their organization are more likely to stay.
Some examples of manager behaviors that seem to increase employee satisfaction and commitment include setting challenging yet achievable goals, formulating and sharing a vision that inspires and motivates the team, or simply leading by example — behaving consistently with what we expect from others.
Stress
Apparently, employee stress levels don’t have as much direct impact on turnover as one could expect, but similar to the manager’s behavior, they are related to job satisfaction and well-being.
How do I calculate turnover?
Measuring and analyzing turnover and its antecedents is quite complex and requires considering several steps. Assessing the levels of turnover in your company or department is a good point to start.
Here is a basic formula to estimate the turnover rate:
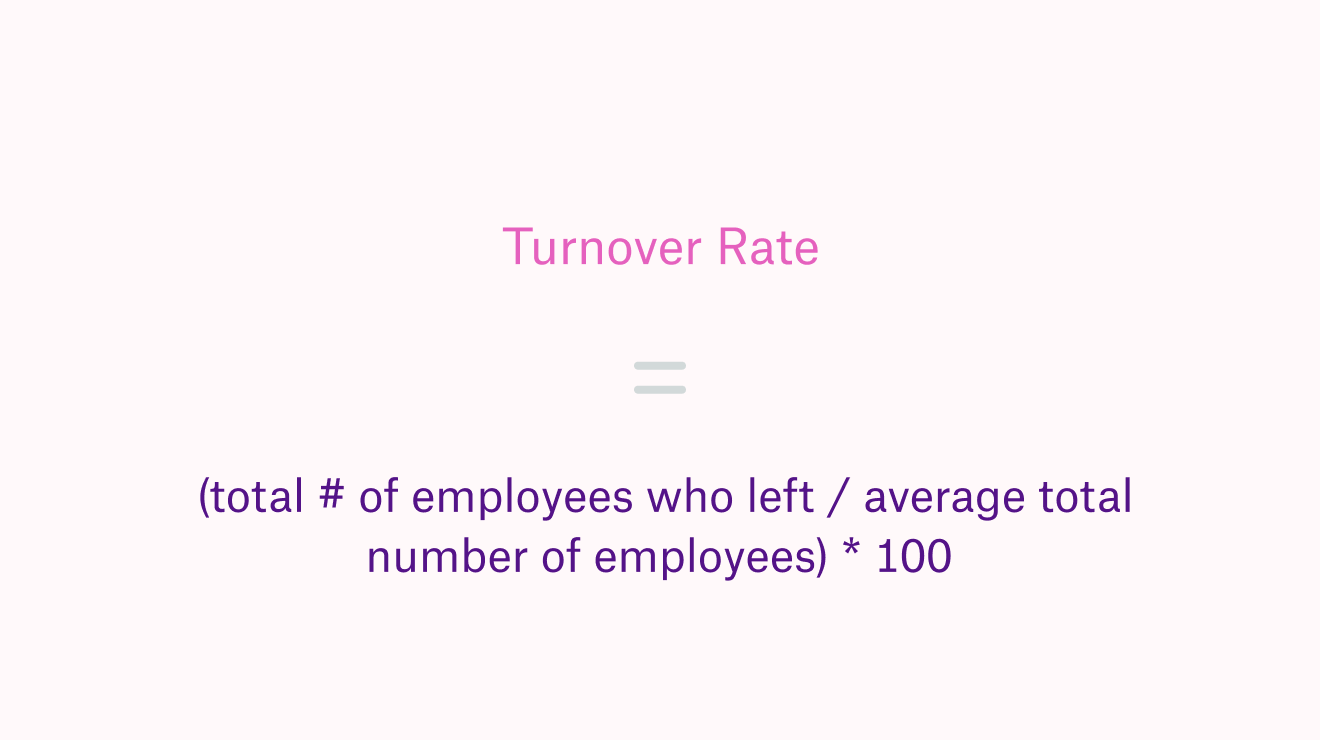
The result that we obtain represents the turnover rate in a specific period of time that we should define.
The components of the formula refer to the total number of employees who left the company at this time, and the average number of employees is estimated by taking the number of employees at the beginning (timestamp 1) and at the end (timestamp 2) of our time frame, and averaging those.
However, we can also make a more precise measurement by capturing the average number of employees each month in between those two timestamps.
For example, if you want to see the turnover for the past 6 months, you would take the average number of employees for each month, by looking at the number of employees at the beginning and the end of the month within the time frame.
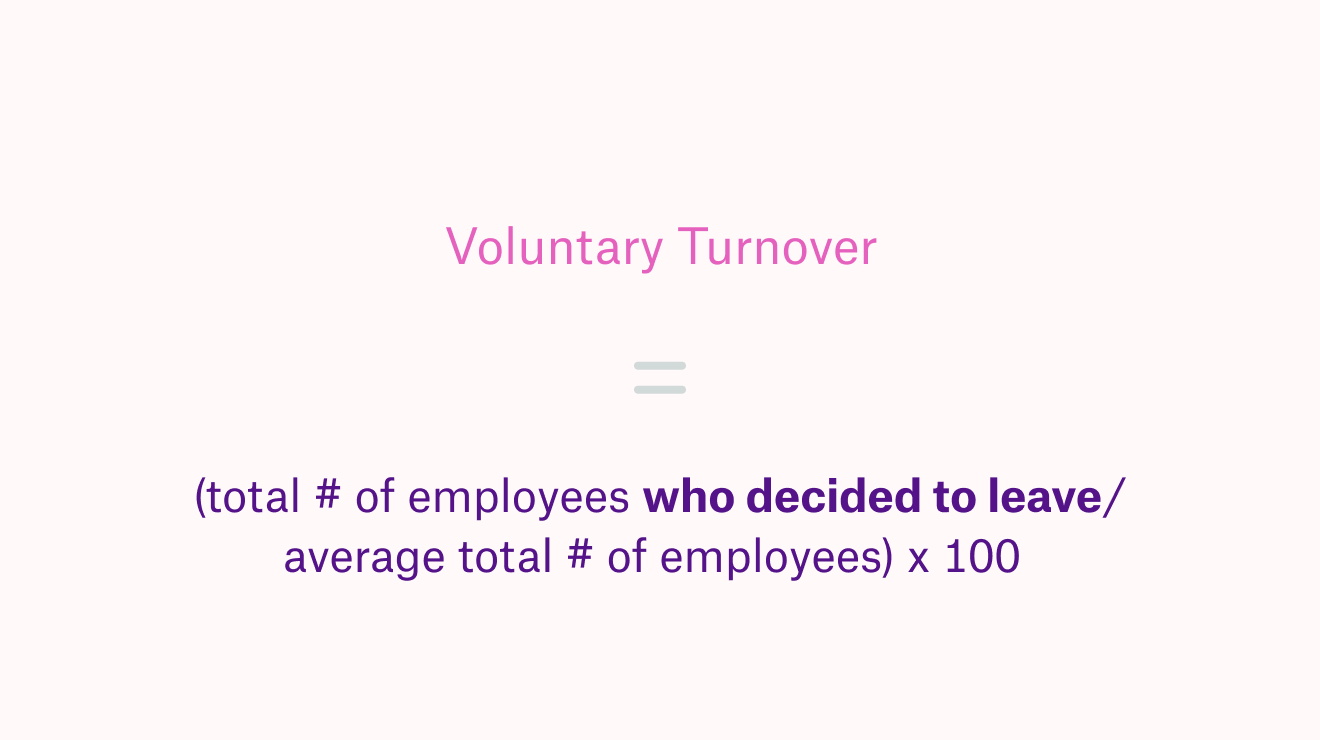
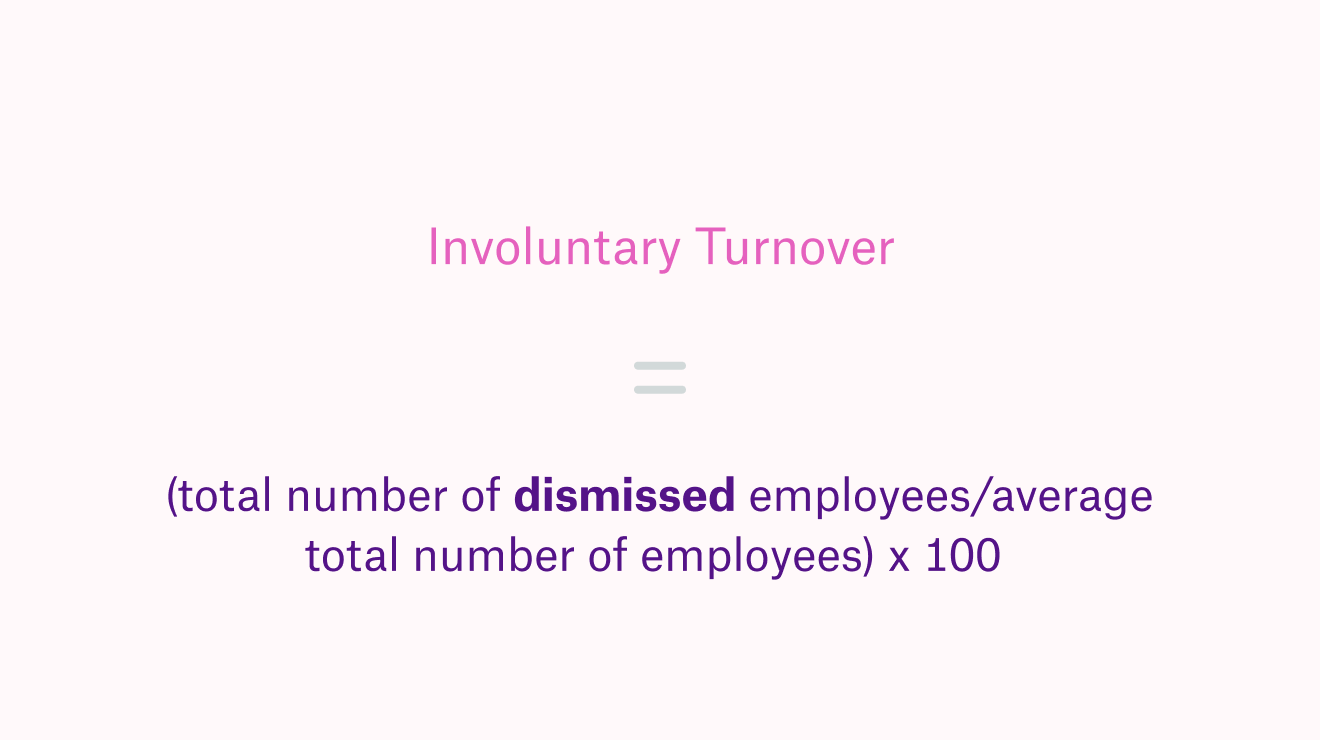
Following the same logic, you can calculate voluntary and involuntary turnover:
VOLUNTARY TURNOVER
INVOLUNTARY TURNOVER
You can also display turnover rates on a chart:
How do I predict turnover?
Although it is good to be aware of the turnover rate, what we really want to know is how to control it. In other words — which conditions make employees more eager to stay or leave the company.
Insights from research give us useful hints about what factors we should keep an eye on (i.e. job characteristics, salary, managers’ behavior, levels of stress).
But the more details about the reasons for resignation you have, the more accurate predictions about future turnover you can make — consider gathering this information through the exit surveys.
Once you identify what conditions were crucial for those who resigned, you can measure and compare them in your current workforce.
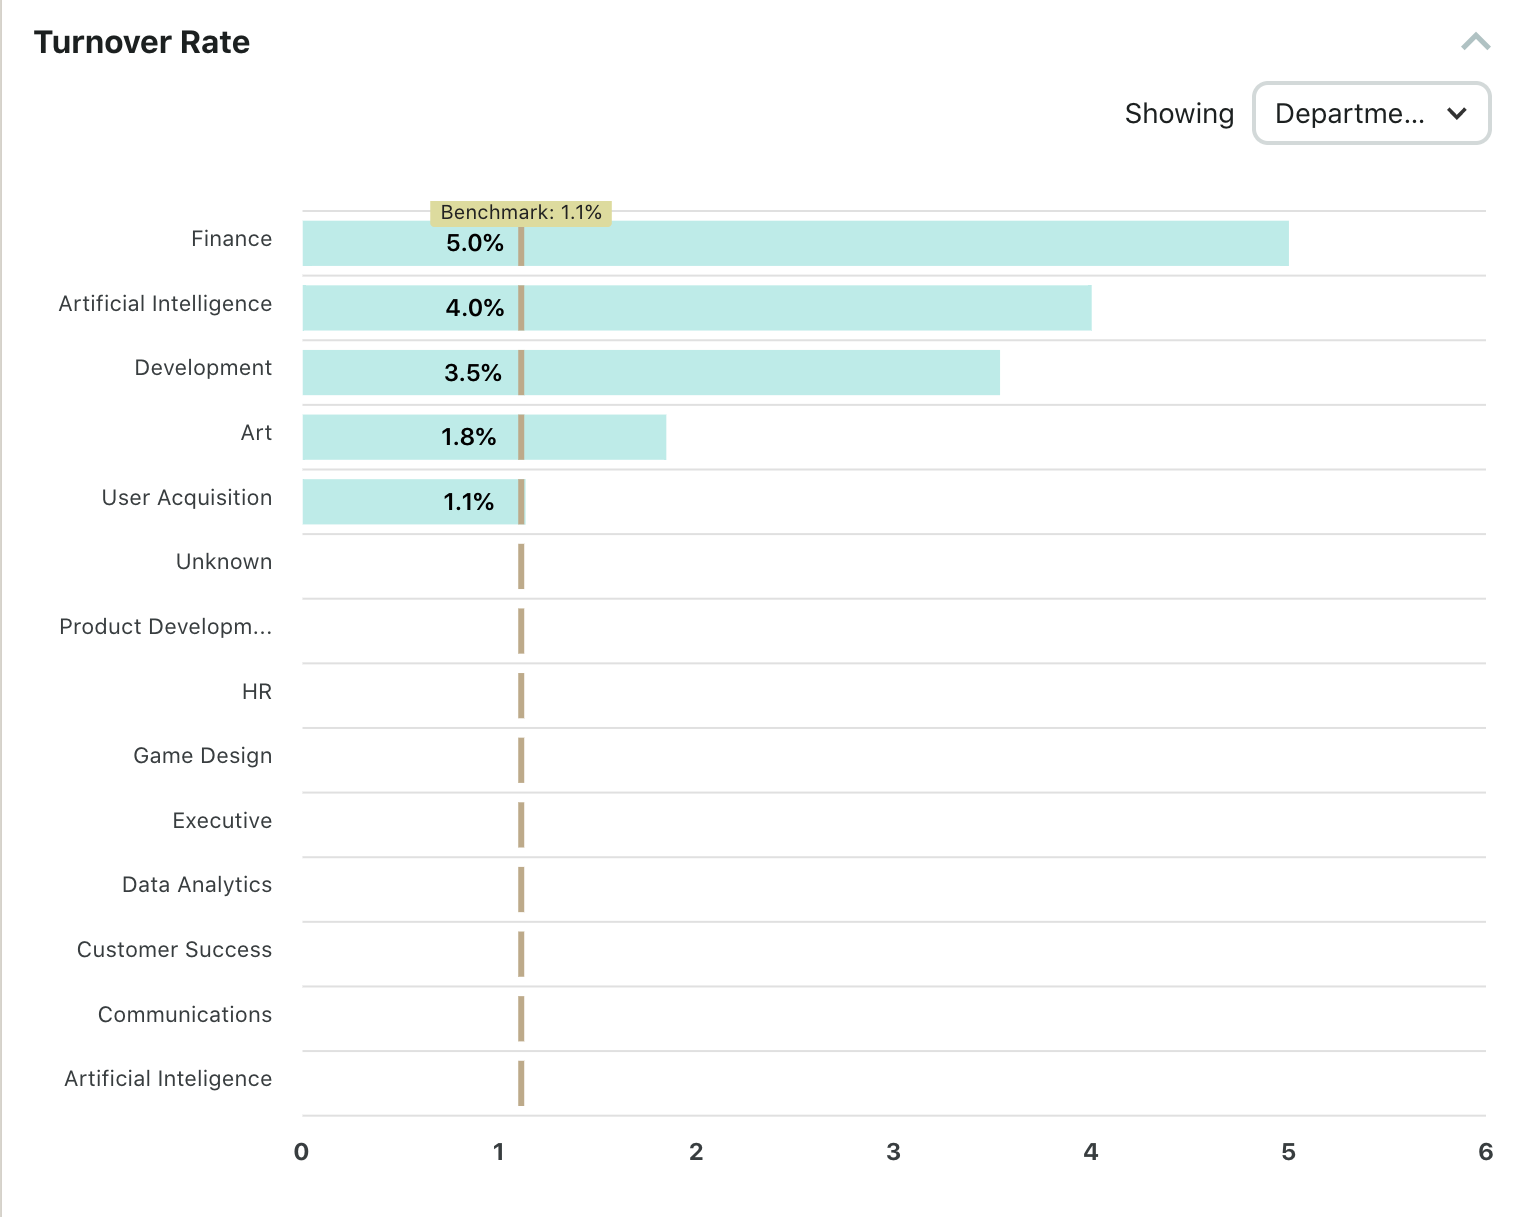
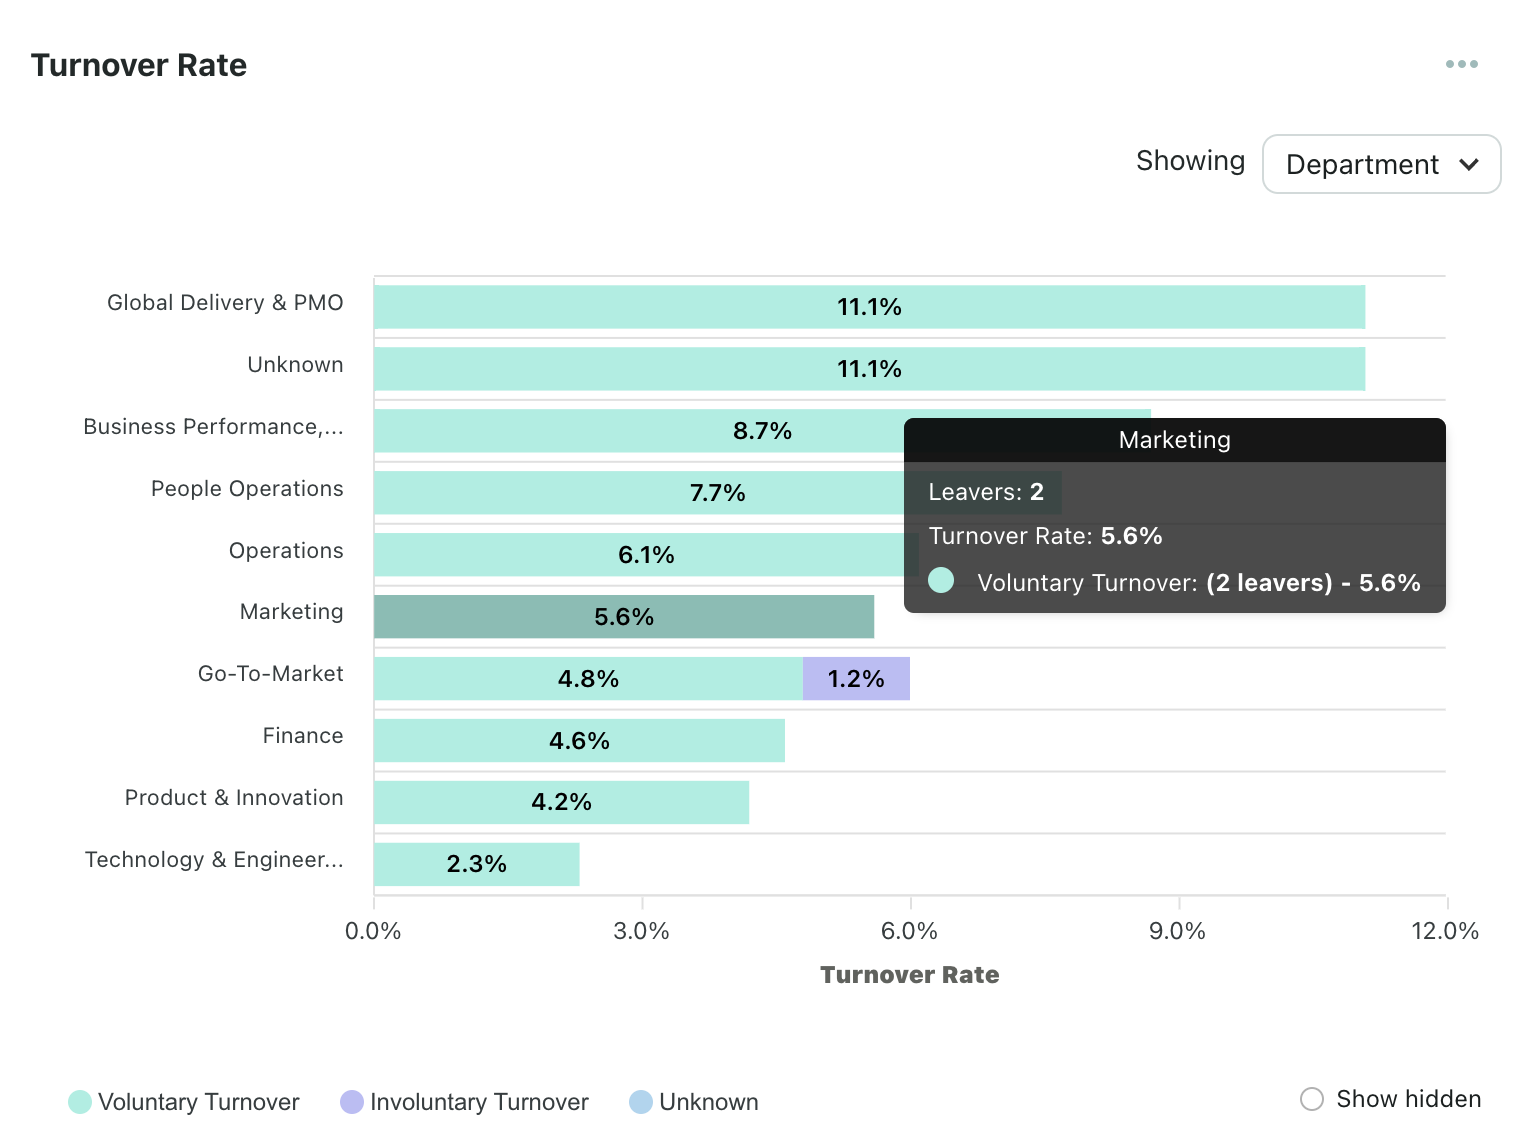
Here is an example of a chart with turnover rates and values of a potentially relevant variable across departments:
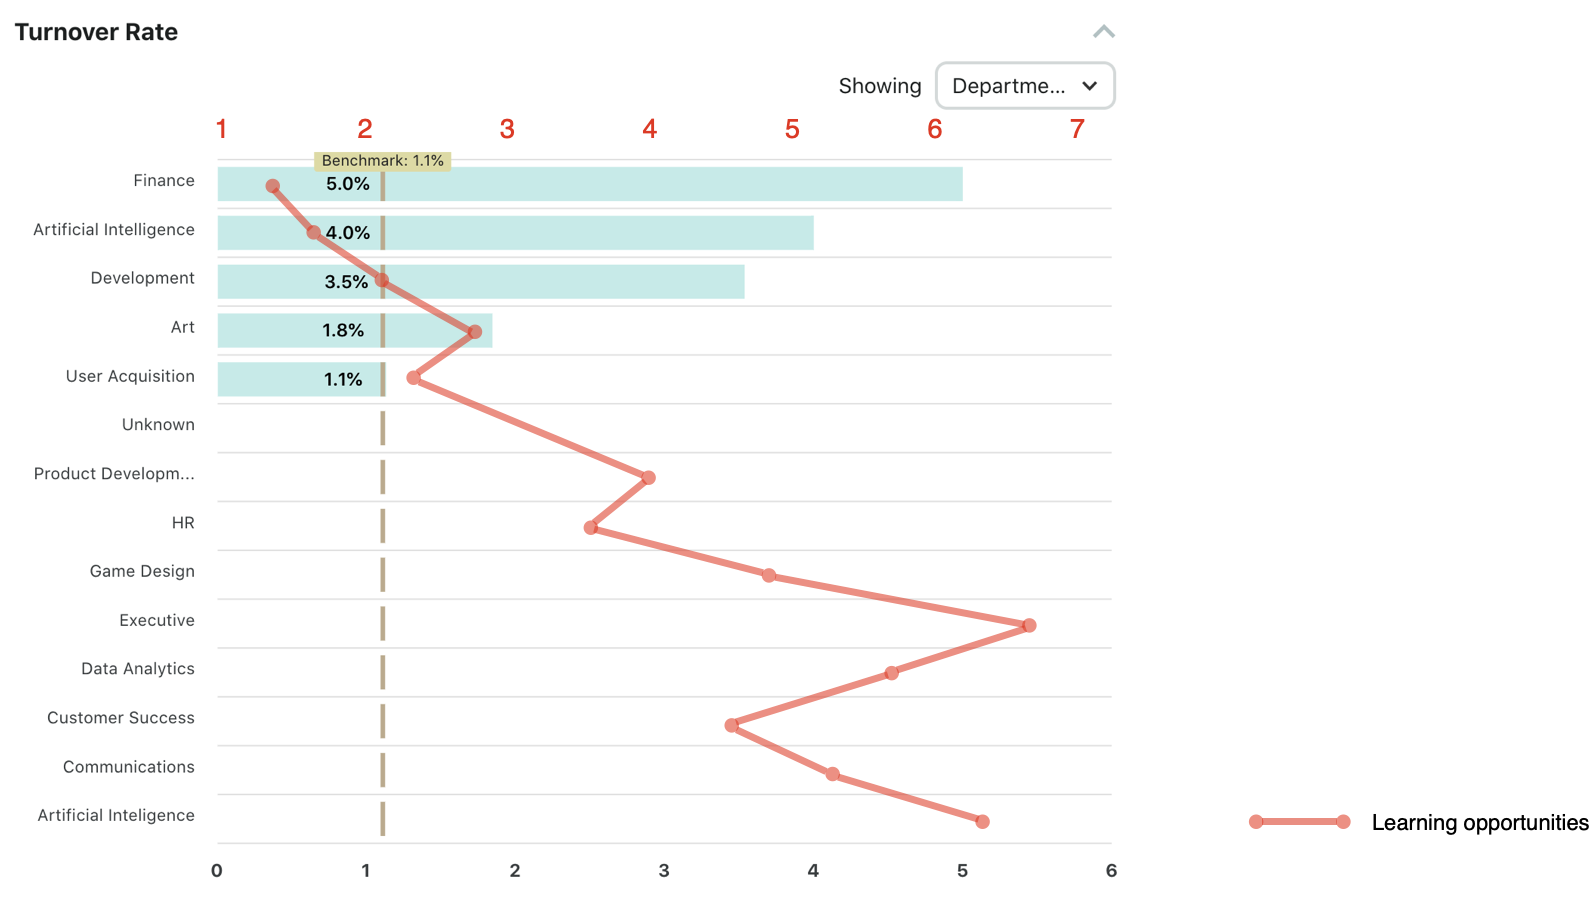
Visualizing this data gives us interesting insights and poses further questions.
Turnover rates across different groups are rarely going to be the same, but that does not mean there is always a cause for panic.
More specifically, some differences might not represent an underlying trend in turnover behavior.
Therefore, you can further analyze the magnitude and the significance of specific differences using a statistical procedure called analysis of variance (i.e. ANOVA) when the outcome variable is continuous, e.g. turnover rate across departments.
Alternatively, you can use the chi-square statistic, when comparing two categorical variables, e.g. stayers and leavers vs male and female employees.
With information on the magnitude and significance of the differences, your reports will be even more data-informed. And as a result, you will know with greater certainty if there are any groups which might require your immediate attention.
Why exit interviews data matter?
Having information about turnover (e.g. turnover rate) and the factors that relate to employees’ intentions to stay or leave, we can make predictions about future turnover of our workforce using regression analysis.
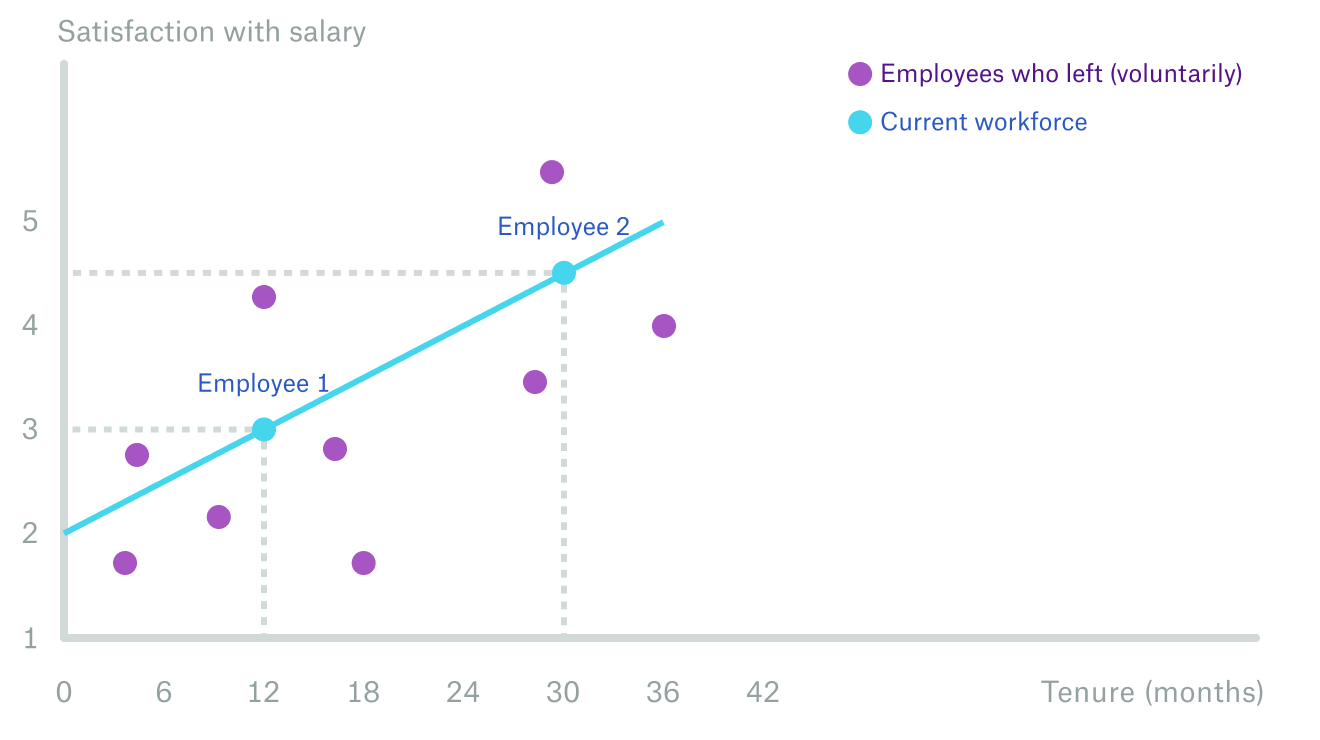
For example, using data collected in the exit survey, we can predict the time after which employees would leave the company, considering different levels of their satisfaction with salary.
Take a look at this graph that illustrates this example:
Although regression analysis provides valuable information about turnover probability in different employee groups, you must be aware that it is based on associations among variables, and its results can’t be interpreted as cause-and-effect relationship.
Following our example, a higher probability of turnover among employees, who are unhappy with their salary doesn’t necessarily mean that dissatisfaction with salary caused turnover in this case.
Analyzing the impact of the actions that we take to reduce turnover would require including a control group, pre-measure, or measurements at multiple time points.
One can expect that turnover results from different factors and their interactions.
Measure employee satisfaction holistically
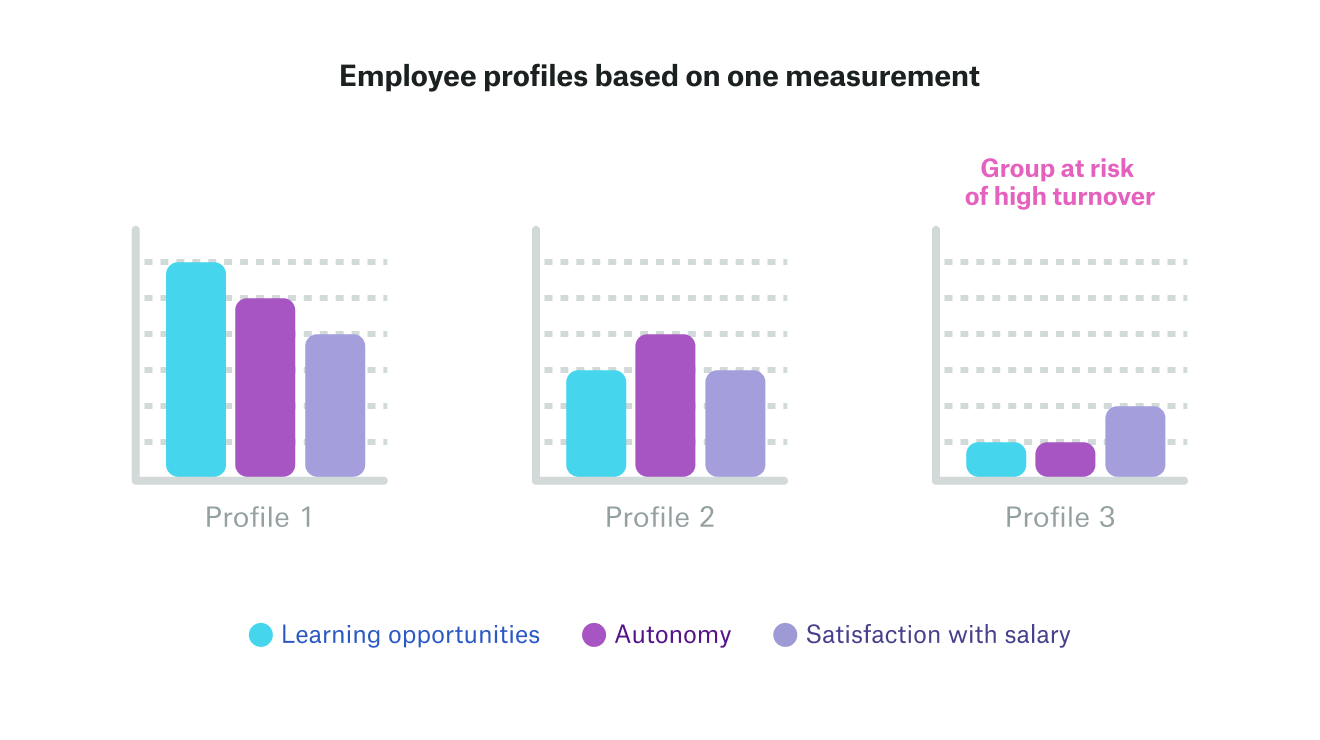
Another interesting approach that helps grasp the complex relationship of turnover and its potential antecedents is cluster analysis (i.e. the analysis centered on a person, not on a variable).
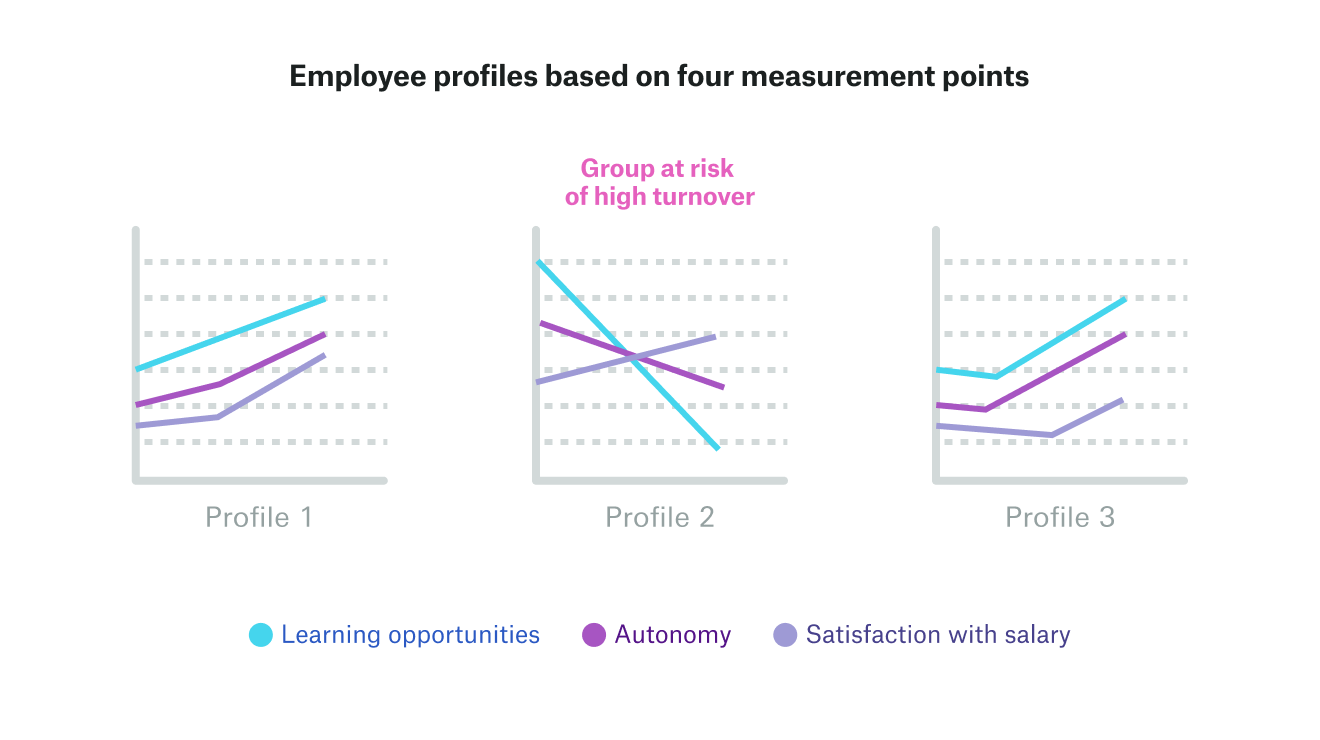
With this approach you can explore profiles of employees characterised by different levels of variables, and analyze which of them are at high risk of turnover.
Ideally, you analyze data across several measurement occasions.
Sometimes the trend that the examined variables follow may be a better predictor than the variable’s level.
For example, an employee whose job satisfaction is overall moderate, but slightly increasing over time, might be less likely to leave than an employee who was very satisfied with the job at the first measurement, but with time their satisfaction deteriorated significantly.
How can I keep turnover under control?
As you can see, predicting turnover is quite complex. You may be wondering “how can I make the best use of all the information that I get from the analyses?”
Look at industry average
Having a good understanding of the organization and the market is an important basis. Once you estimate turnover rates, compare them to the industry average.
Remember that a certain number of people who resign is normal and not necessarily bad — for example, when low performers leave the company. But if you lose employees much more often than your competitors, it’s a clear sign that you should act quickly.
Compare turnover rates across departments and groups
Comparing the turnover rates across departments and different groups of employees (e.g. roles, ages, gender…) is another source of valuable information.
It may help find out what groups are more likely to resign, so you can act and potentially prevent the unwanted leaves. The more we know about the reasons for turnover, the more precise and effective interventions we can implement.
That’s why you should gather data about factors that potentially increase or decrease turnover. It may be challenging (and not necessary) to take the same actions in the whole organization, but knowing the source of the problem we can design interventions targeted to the groups in which the risk of turnover is higher.
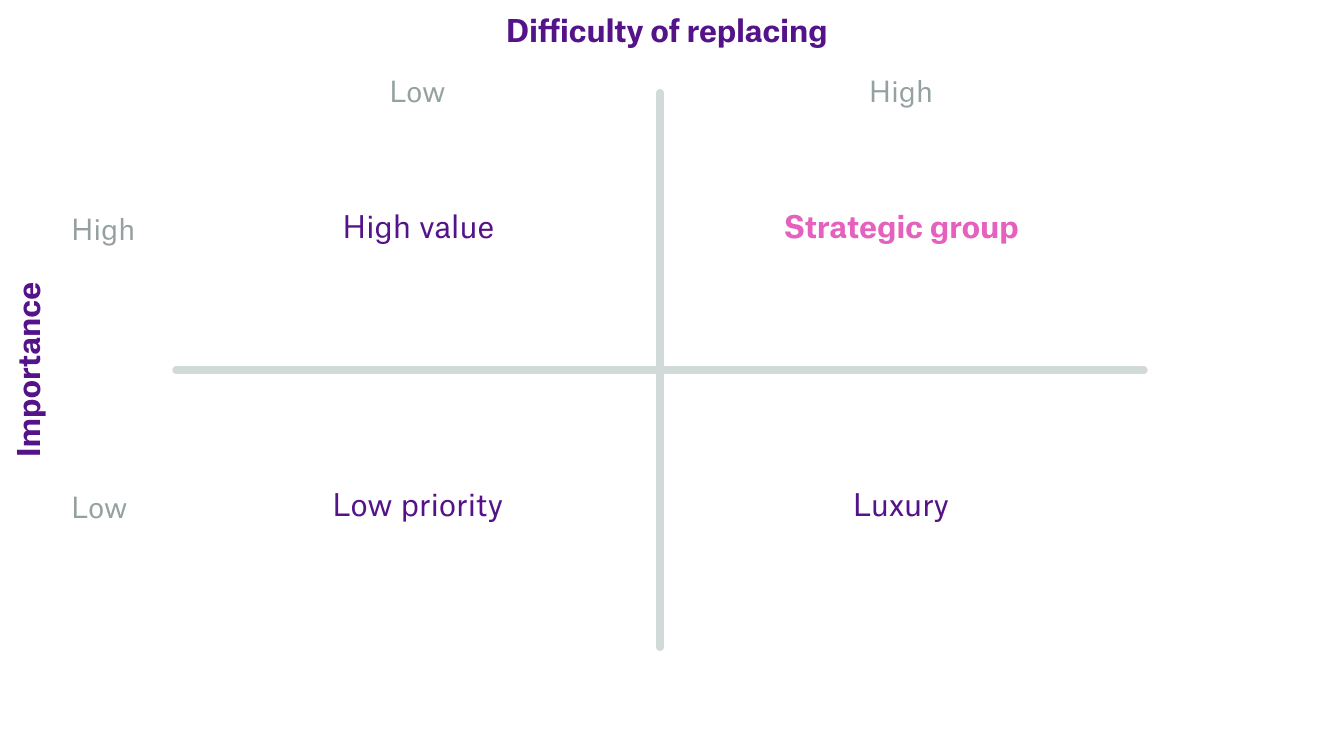
Be strategic about tackling turnover
If your resources to deal with turnover are tight, you may want to define and prioritize “strategic groups” of employees (i.e. employees whose role is strategic for the project, department or the entire organization, and who are difficult to replace).
The employees that belong to both, the strategic group and a profile at risk of leaving, should be the first to target.
Finding out what factors cause turnover require further analysis of our workforce (including pre- and post-intervention comparisons, or intervention group vs control group comparisons).
Fortunately, as we explained in the introduction, there is good-quality research that tested possible antecedents of turnover, and are a solid basis to plan interventions to reduce turnover, related, for example, to manager behavior and job characteristics.
How to automate voluntary turnover monitoring?
Losing people who are key to your organization costs you time and money, and can seriously hurt your business.
At the same time, putting together manual calculations on top of all other reports and tasks related to talent management can slow down day-to-day work, which in turn affects your strategic work as well.
Good thing is that by automating your turnover monitoring, you don’t need to do the guesswork of whether your top talent leaves next week.
Instead, you get detailed information about turnover in your department or company, such as the rate of voluntary and involuntary leaves, the number of resignations that could have been avoided, or the risk of turnover for your employees.
For instance — with Orgnostic, you can get insights on employees at risk of leaving across departments, track turnover rate across roles, or get insights into reasons for leaving – in just a couple of steps:
- Register on the Orgnostic Platform
- Connect your HRIS to Orgnostic
- Once your data is ready, head over to Story
- Then, go to the Turnover chapter
- There, head to the Turnover rate.
You can also run surveys (including exit surveys) to quickly measure variables related to turnover, such as employee rewards systems.
This then feeds your strategy on how you retain your talent, across departments, roles, and various demographics.